
Report templates
Depending on the type of survey, one or more report templates can be configured. The reports are created following the survey and based on these templates.
In der obersten Leiste werden die konfigurierbaren Berichtsvorlagen angezeigt. Das Beispiel hier erscheint beim Befragungstyp “Mitarbeiter- oder Pulsbefragung”.

The report templates have recommended uses, but can be configured individually depending on the application scenario.
Report templates for survey type “Employee or pulse survey”
Focus reports
Focus reports are typically prepared for each department and distributed to the relevant managers after the survey.
Focus report 1 contains the survey results of the respective department and an upward comparison, i.e. a comparison with higher-level departments and a comparison with the results of the entire company.
Focus report 2 contains the survey results of the respective department and a downward comparison, i.e. a comparison with subordinate departments.
Management report
The management report contains detailed results of various evaluations at an organization-wide level. These evaluations can be made according to demographic characteristics or departments, for example.
The recipients of this type of report are usually the HR department and the Management Board.
Comprehensive report
The comprehensive report summarizes the most important results at an organization-wide level.
The recipients of this type of report are usually the HR department and the Management Board.
Report templates for survey type “360° feedback”
Overall result report
The overall results report usually contains detailed results of the feedback.
The recipient of this type of report is the feedback recipient.
Supervisor report
The supervisor report usually contains superficial information on the survey results.
The recipient of this type of report is the supervisor of the feedback recipient.
Employee report
The employee report usually contains superficial information on the survey results.
The recipients of this type of report are employees of the feedback recipient.
Pages
Certain page templates can be selected below the report templates, which can be displayed in the report before the results are presented (apart from the appendix, which appears at the end of the report).

Cover
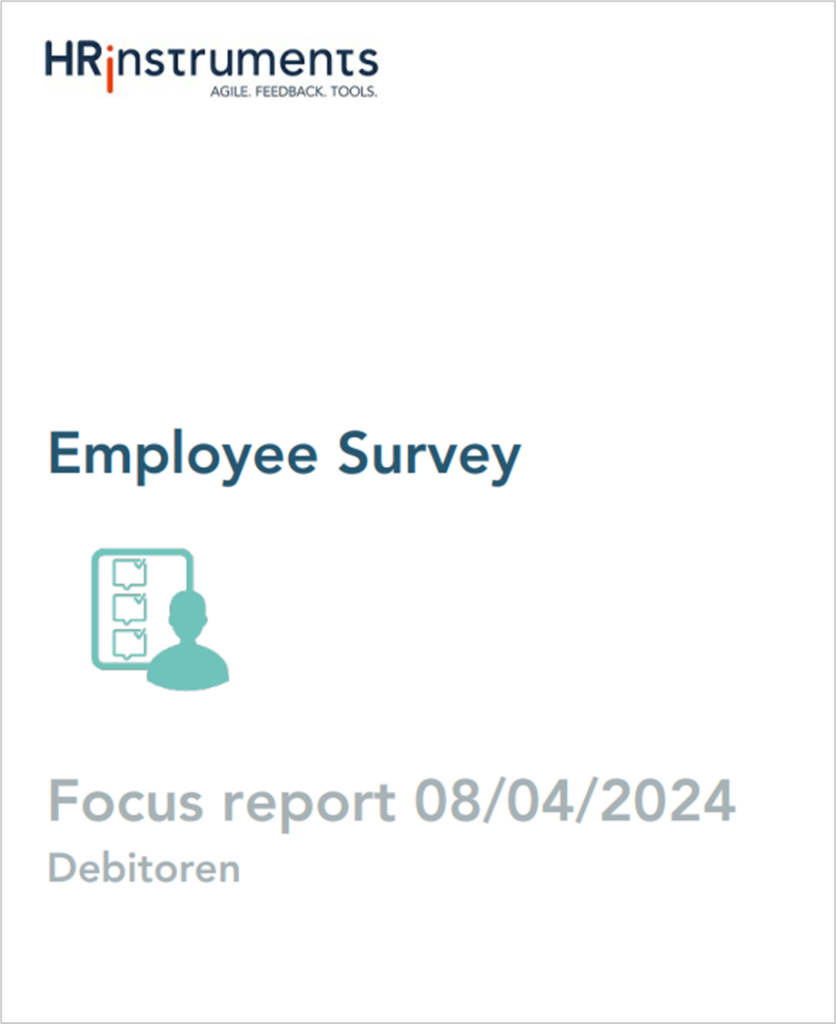
The cover page is a possible template for the first page of the report and shows the name of the survey and the report, the day the report was created and the image for the cover page, which was defined in the “Graphical Adjustment” tab.
Intro
If this checkbox is activated, a text field appears in which an introductory text for the report can be formulated. Detailed information on the text field toolbar can be found here.
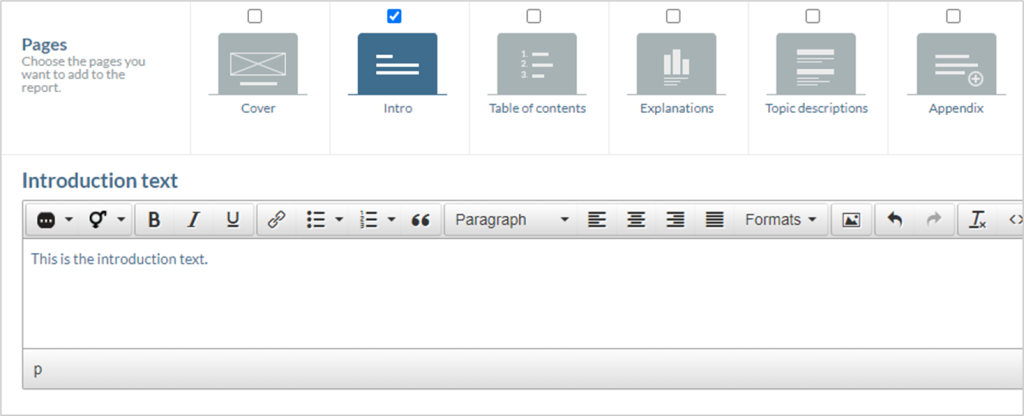

Table of contents
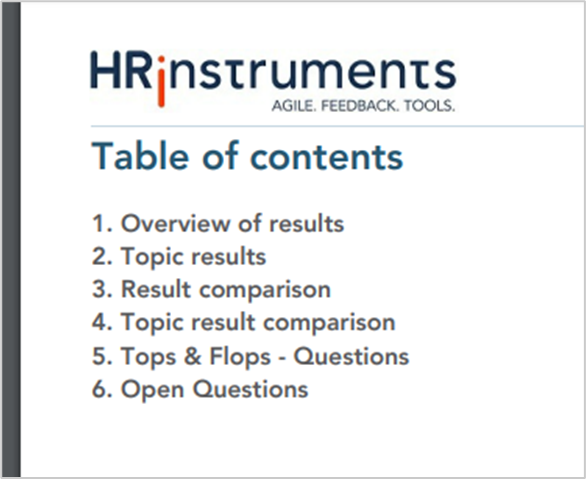
In the table of contents, the report elements are listed in the order in which they appear in the report.
Explanations
The explanation provides general information on the meaning of key figures and survey elements that appear in the reports.
The specific content of the explanations depends on the individual settings of each survey. The example below contains explanations of percentages, the attitude scale and the “mean value” and “number of responses” parameters.
Topic descriptions
In the “Topics and questions” tab, an explanation of the topic itself and the underlying questions and answer options can be stored for each topic. When creating or editing a topic, this is possible via the “Edit” button at the top right of the topic tile.
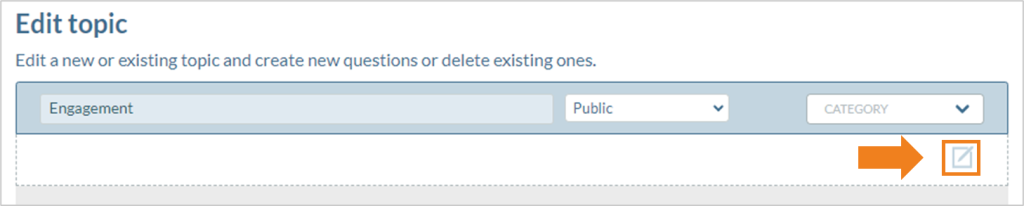
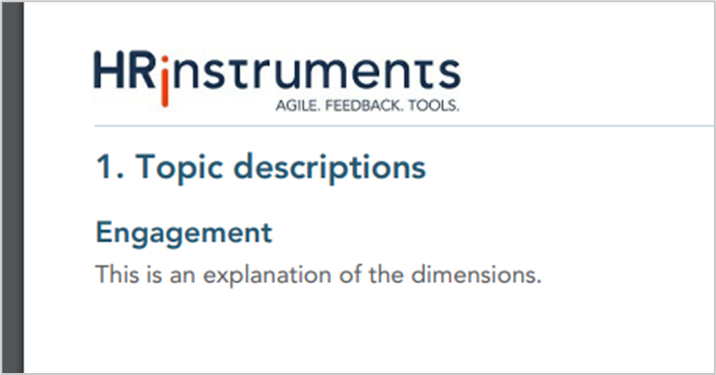
If an explanation of the dimensions is stored there and the corresponding page is activated in the report tab, this description appears under the respective topic name; in the example below for the topic “Engagement”.
Appendix
If the appendix is selected as a page template, a text field appears for comments that appears on the last page of the report. For example, information for the follow-up process can be stored here.
Report elements
Depending on the type of survey, the options available for displaying the results may vary.
Feedback for Executives & Feedback for higher Executives
- Demography
- Topic results
- Topic results broken down by demography or by user attributes
- Question results by tag
- Results broken down by demography or user attributes
- Overview of results
- Overview of results by tag
- Results table
- Possible blind spots
- Possible blind spots (Questions)
- Open questions
- Tops & Flops (Questions)
- Tops & Flops
- Time comparison for topic results
- Time comparison
360° feedback
Comprehensive report, supervisor report & employee report
- Demography
- Topic results
- Topic results broken down by demography or by user attributes
- Question results by tag
- Results broken down by demography or user attributes
- Overview of results
- Overview of results by tag
- Results table
- Possible blind spots
- Possible blind spots (Questions)
- Open questions
- Tops & Flops (Questions)
- Tops & Flops
- Time comparison for topic results
- Time comparison
Team survey
- Demography
- Topic results
- Topic results broken down by demography or by user attributes
- Question results by tag
- Results broken down by demography or user attributes
- Overview of results
- Overview of results by tag
- Results table
- Open questions
- Tops & Flops (Questions)
- Tops & Flops
- Time comparison for topic results
- Time comparison
Employee or pulse survey
Focus reports 1 & 2
- Demography
- Topic results
- Topic results broken down by demography or by user attributes
- Topic results by question categories
- Question results by tag
- Topic results broken down for sub-departments
- Topic results comparison
- Topic results comparison by question categories
- Results of the individual questions grouped by tag with upward comparison
- Results broken down for sub-departments
- Overview of results
- Overview of results grouped by question categories
- Results broken down by demography or user attributes
- Overview of results by tag
- Results of tags with upward comparison
- Results table
- Result comparison
- Result comparison grouped by question categories
- Open questions
- Tops & Flops (Questions)
- Tops & Flops
- Time comparison
- Time comparison for topic results
- Time comparison for topic results combined with parent department comparison
- Time comparison for topic results combined with topic results broken down for sub-departments
- Time comparison combined with parent department comparison
- Time comparison combined with results broken down for sub-departments
Management report & Comprehensive report
- Demography
- Topic results
- Topic results broken down by demography or by user attributes
- Topic results by question categories
- Topic results by question categories broken down by department
- Question results by tag
- Topic results broken down by department
- Results broken down by department
- Overview of results
- Overview of results grouped by question categories
- Overview of results grouped by question categories broken down by department
- Results broken down by demography or user attributes
- Overview of results by tag
- Results table
- Open questions
- Tops & Flops (Questions)
- Tops & Flops
- Time comparison
- Time comparison for topic results
Performance evaluation
- Demography
- Topic results
- Topic results broken down by demography or by user attributes
- Question results by tag
- Overview of results
- Results broken down by demography or by user attributes
- Overview of results by tag
- Results table
- Open questions
- Tops & Flops (Questions)
- Tops & Flops
- Employee development
- Time comparison for topic results
- Time comparison
- Goals (rating)
- Goals (new)
Peer feedback
- Demography
- Topic results
- Topic results broken down by demography or by user attributes
- Question results by tag
- Results compared to the team’s average
- Overview of results
- Results broken down by demography or user attributes
- Overview of results by tag
- Results table
- Possible blind spots
- Possible blind spots (Questions)
- Open questions
- Tops & Flops (Questions)
- Tops & Flops
- Time comparison for topic results
- Time comparison
- Goals (rating)